Overview:
xf_radial2 takes in FITS files with images projected with xform and
calculates averages along radial lines at a given angle (either
magnetic longitude or magnetic local time, depending on how xform was
configured when it produced the FITS files).
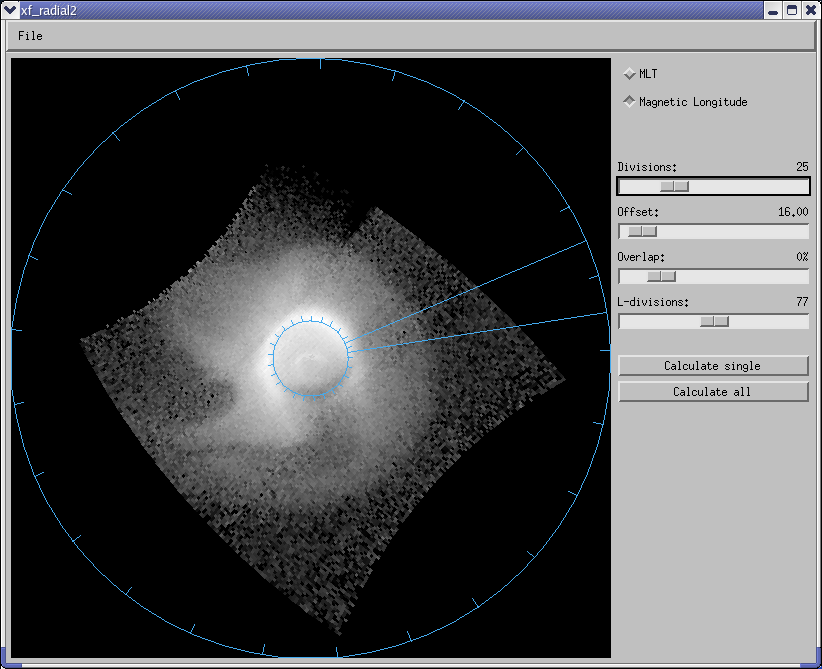
How to use:
FITS files are opened in the traditional manner, simply go up to the
'File' menu and select 'Open FITS file ...'. There are four parameters you can specify. The first one, labelled 'Divisions' is simply the number of divisions the circle is split into. This determines both the default width of each wedge and also the number of wedges taken when 'Calculate all' is selected. The next
is 'Offset' which rotates the starting point counter-clockwise the specified longitude/MLT amount. This is most useful for 'Calculate single', but can also be used to adjust the results of 'Calculate all'. The next parameter is 'Overlap'. This is simply the amount by which the wedges overlap at the sides; negative amounts mean that some of the image is not included in the calculations. Finally, 'L-Divisions' is the parameter which specifies how many regions the wedges are split into. Smaller values lead to larger regions with more points included in the average, while larger values lead to finer resolution.
There are two different ways to run calculations in xf_radial2. The
first, selected with the button labelled 'Calculate single', only does
the calculation on the wedge explicitly drawn in the left window. The
output file for this operation is found at the same path as the input
FITS file, and has '_xfr2_s_' appended to its name along with some of
the parameter settings used to make that calculation. This file is
very simple and consists of two columns: the left column contains
L-values while the right column contains the intensity averages.
The second operation is selected with the button labelled 'Calculate
all'. This performs the same calculation as above, but does so on
every radial divison around the image (as specified by the 'Divisions'
parameter). The first output file for this operation is as above, but
with '_xfr2_m_' appended instead, along with several parameter values
and the extension '.dat'. This file contains a table of L and theta
values, and their corresponding intensity averages. Here theta values
are listed in the first row, with L values listed down the left-most
column. The second output file for this mode has the same filename
but with a '.xyz' extension. This file consists of triplets, each row
containing X and Y values (instead of L and theta values) and the
corresponding intensity average.